
In September 2018 we began reporting ad fraud statistics for the programmatic ad space based on monthly data we collected. In the Q4 2018 Ad Fraud Report we combined data from October, November and December to create a larger picture of ad fraud in terms of which devices, browsers and operating systems are being used most and how much it's affecting different global regions.
Download a copy of this report.
A PDF of our Q4 2018 Programmatic Ad Fraud Report is provided in the link below.

Below are some of the highlights from Q4. Fraudlogix’s pixel-based technology regularly monitors data from 640+ million unique users, 1.2 billion unique devices, and 300+ million URLs monthly. We map the latest devices, locations, bots, behaviors and hacking tactics that are being used by digital fraudsters.
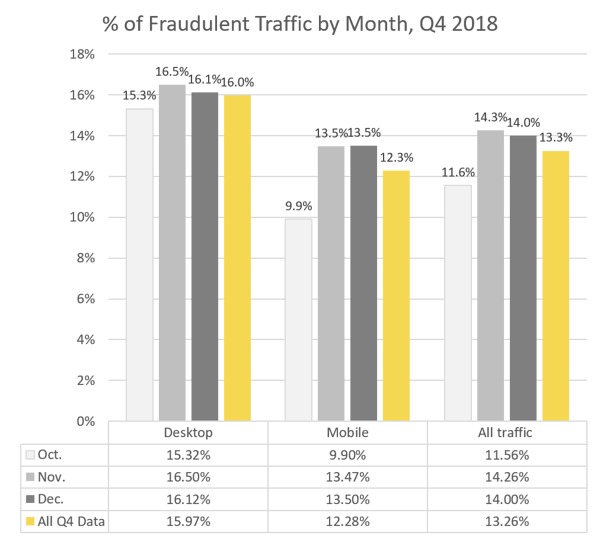
13% of all ad traffic (12% of mobile) was fraudulent.
Looking at digital ad traffic globally (all locations and all device types), we found that 13.3 percent of it was fraudulent, a 7.6 percent increase from the 12.3 percent we reported in September, 2018. The biggest increase in fraud came from mobile traffic, which jumped 29 percent in Q4 from what we reported in September, going from 9.5 percent to 12.3 percent.
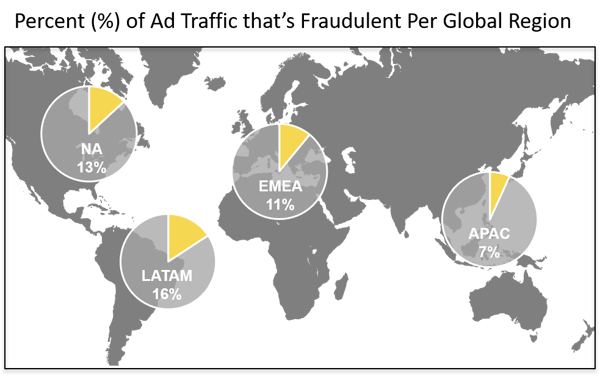
16% of LATAM ad traffic was fraudulent - the highest among four global regions.
Looking at all data during Q4, broken down into four major global business regions [Asia–Pacific, including India (APAC); Europe, the Middle East and Africa, including Russia (EMEA); Latin America, including Mexico (LATAM); and North America (NA)] , we found that the LATAM region had the highest percentage of fraudulent ad traffic at 15.8 percent, followed by North America with 13.1 percent, EMEA region with 11 percent, and APAC region with 6.8 percent.
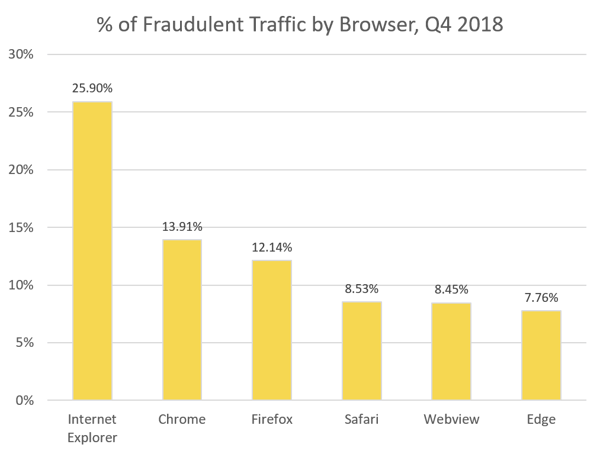
A majority of ad traffic came from Chrome browsers and 14% of it was fraudulent.
Google's Chrome browsers accounted for 68 percent of all ad traffic, and almost 14 percent of it was fraudulent - the second highest percentage of the top six browsers. Microsoft's Internet Explorer had the highest percentage at almost 26 percent.
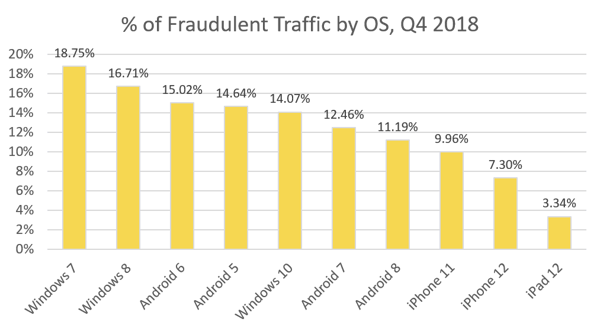
Devices running older versions of Windows OS have the highest amounts of fraudulent traffic.
Devices running Windows 7 operating systems had the highest percentage of fraudulent traffic (19 percent) among the ten most-popular operating systems. Windows 8 came in second with 17 percent and Android 6 in third with 15 percent.
Keeping the industry updated on the latest data and threats we see in the digital ad community is important, so we we'll be publishing regular updates on ad fraud percentages as well as which countries, devices, browsers and operating systems are being taken advantage the most for ad fraud schemes. Stay tuned.
