Not all ad traffic is created equal. Fraudulent traffic can skew campaigns, poison analytics, and waste advertising dollars on non-human ad views. Ad fraud numbers are an important metric to keep an eye on in the digital ad industry and can vary depending on device types and locations where ads are served.
Download a copy of this report.
A PDF of our Global Ad Fraud Report for September 2018 is provided in the link below.
At Fraudlogix, we looked at 30 days of data from September 2018 so we could paint a current picture of how much fraudulent traffic is flowing through the real time bidding (RTB) pipelines, which devices are more susceptible to it, and which areas of the world are more likely to be hit with it. Below are the results from that. Fraudlogix’s pixel-based technology regularly monitors data from 640+ million unique users, 1.2 billion unique devices, and 12 million URLs monthly. We map the latest devices, locations, bots, behaviors, and hacking tactics that are being used by digital fraudsters. Here's some highlights of what we found:
Globally, 12% of all digital ad traffic was fraudulent.
By fraudulent, we mean that the ad impressions were generated by bots, compromised devices, and other nefarious means, rending the impressions fraudulent (i.e., advertisers paid for these impressions with the understanding that they would be served to humans and they were not). Looking at digital ad traffic globally (all locations and all devices), we found 12.32% of it to be fraudulent.
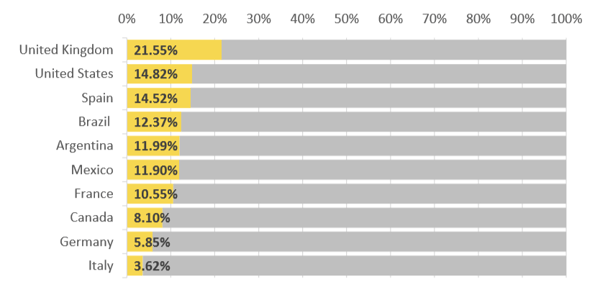
The UK saw the highest percentage of ad fraud at 22%, followed by the US at 15%.
We looked at the data we had from a geographical perspective and found that some countries saw much higher percentages of fraudulent ad traffic. From the ten countries with the highest ad traffic volume that we observed, the United Kingdom topped the list with 21.55% fraudulent ad traffic. The United States came in second with 14.82% fraudulent ad traffic. The chart below shows the percentage of fraudulent traffic from the ten countries with the highest volume of ad traffic observed. 
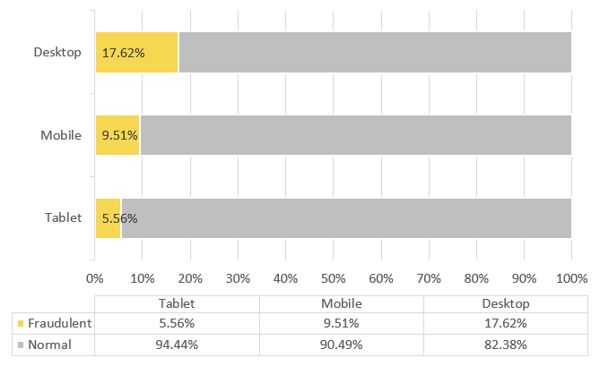
Digital ad traffic from desktop devices was 18% fraudulent while mobile was 10% fraudulent.
We also broke down the data to the percentages of fraudulent ad traffic by device type. We found that desktop traffic tended to be much riskier, with 18% of it fraudulent, while 10% of mobile ad traffic was fraudulent and 6% of tablet ad traffic was fraudulent. The chart below shows the percentage of fraudulent traffic by device type. 
Keeping the industry updated on the latest data and threats we see in the digital ad community is important, so we we'll be publishing regular updates on ad fraud percentages as well as which countries, devices, browsers, and operating systems are being taking advantage the most for ad fraud schemes. Stay tuned.


