
The latest data collected during Q2 2019 reveals that Google's Android OS was the most popular family of operating systems, however, almost 15 percent of ad traffic coming from those devices was fraudulent. Apple's iPhones fared better with only about 5 percent of ad traffic found to be fraudulent. Ad traffic from desktop devices running Microsoft's Windows OS was 14 percent fraudulent while only about 6 percent of traffic coming from Apple's Mac OS was fake.
Download a copy of this report.
A PDF of our Q2 2019 Programmatic Ad Fraud Report is provided in the link below.

This post concentrates on the percentage of fraud that came from devices running the most-common operating systems. We've grouped together numerous versions of each OS into OS families. Keep in mind that Fraudlogix’s pixel-based technology regularly monitors data from 710 million unique users, 1.2 billion unique devices, and 300+ million URLs and apps monthly. We map the latest devices, locations, bots, behaviors and hacking tactics that are being used by digital fraudsters within mobile, in-app, display, video, and OTT environments. Key data around operating systems and ad fraud is included below.
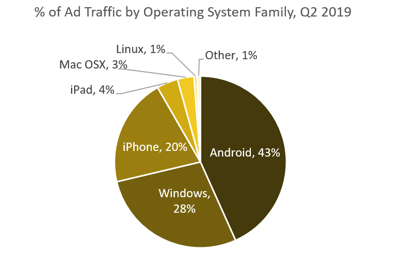
Android OS was the most commonly observed operating system
In Q2 the most common operating system family observed was Android (43%), followed by 28% Windows, 20% iPhone, 4% iPad, 3% Mac OSX. and 1% Linux.
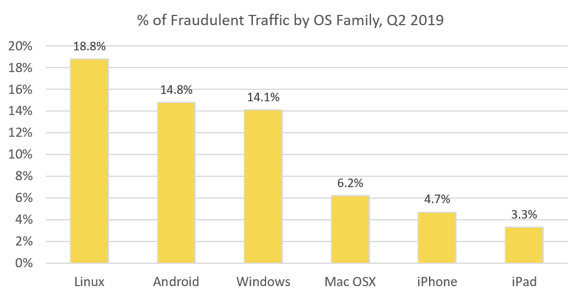
14.8% of Android ad traffic was fraudulent
While ad traffic coming from Linux operating systems had the highest percentage of fraud at 18.8%, ad traffic from the most common OS (Android) was 14.8% fraudulent. Ad traffic from the iPhone OS family was 4.7% fraudulent. Traffic from devices running Windows was 14.1% fraudulent, MacOSX 6.2%, and iPad 3.3% fraudulent.
Keep an eye out for further insights.
In September 2018 we began reporting ad fraud statistics for the programmatic ad space based on monthly data we collected. We then published our first Quarterly Ad Fraud Report with data from Q4, 2018. We're continuing this coverage with our Q2 2019 Ad Fraud Report, which includes data on which devices, browsers and operating systems are being used most for fraud and what areas of the world fraudulent traffic is originating from.
Keeping the industry updated on the latest data and threats we see in the digital ad community is important, so we we'll be publishing regular updates on ad fraud percentages as well as which countries, devices, browsers and operating systems are being taken advantage the most for ad fraud schemes. Stay tuned.
