
In our last post on digital ad fraud we talked about the overall percentages of fraudulent ad traffic and briefly broke it down by country. We found that globally 12% of ad traffic was fraudulent. But there's normally a big difference in the amount of fraudulent traffic between desktop and mobile devices and different regions of the world also have different levels. So in this post we're digging deeper into the data and breaking it down by global region and device type.
Download a copy of this data.
A PDF of our Ad Fraud Region Report for September 2018 is provided in the link below.

As a refresher, these results stem from the analysis of digital ad traffic that we observed in September 2018. Our pixel-based technology regularly monitors data from over 640 million unique users, 1.2 billion unique devices, and 12 million URLs monthly. We map the latest devices, locations, bots, behaviors, and hacking tactics that are being used by digital fraudsters. The fraudulent percentages reported here represent ad traffic determined to be generated by malware, bots, compromised devices, and other nefarious means, rendering it fraudulent. The data here is broken down into four major business regions: APAC (Asia–Pacific, including India), EMEA (Europe, the Middle East and Africa, including Russia), LATAM (Latin America, including Mexico), and NA (North America).
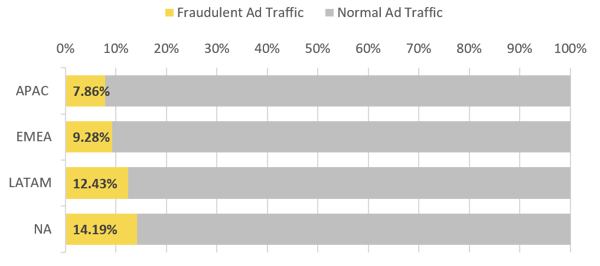
North America Has Highest Percentage of Fraudulent Traffic.
Of the four global regions, North America had the highest percentage of fraudulent ad traffic at 14%, followed by LATAM with 12%, EMEA at 9%, and APAC at 8%:
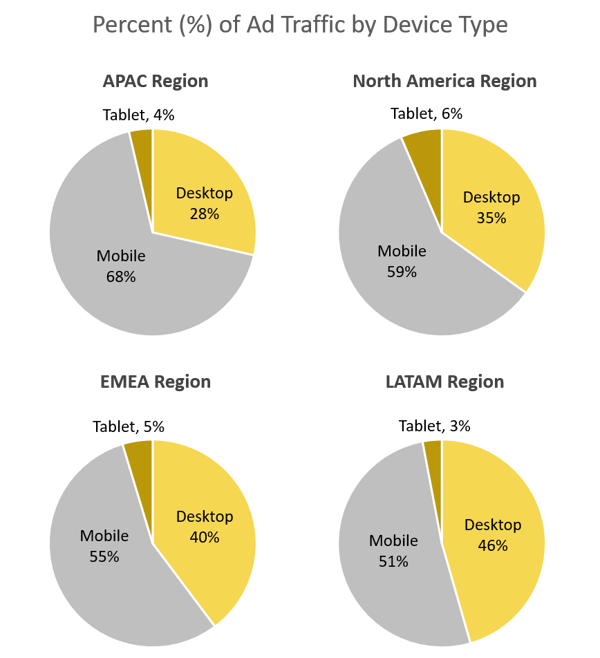
Ad Traffic By Region and Device Type
Before we get to how much traffic is fraudulent per device, it's worth noting that the percentages of desktop and mobile ad traffic varied across regions. In the APAC region 68% of ad traffic was from mobile devices, 28% desktop, and 4% tablet. In North America 59% of ad traffic was from mobile, 35% desktop, and 6% tablet. In the EMEA region 55% was from mobile, 40% desktop, and 5% tablet. And in the LATAM region 51% of ad traffic was from mobile devices, 46% desktop, and 3% tablet:
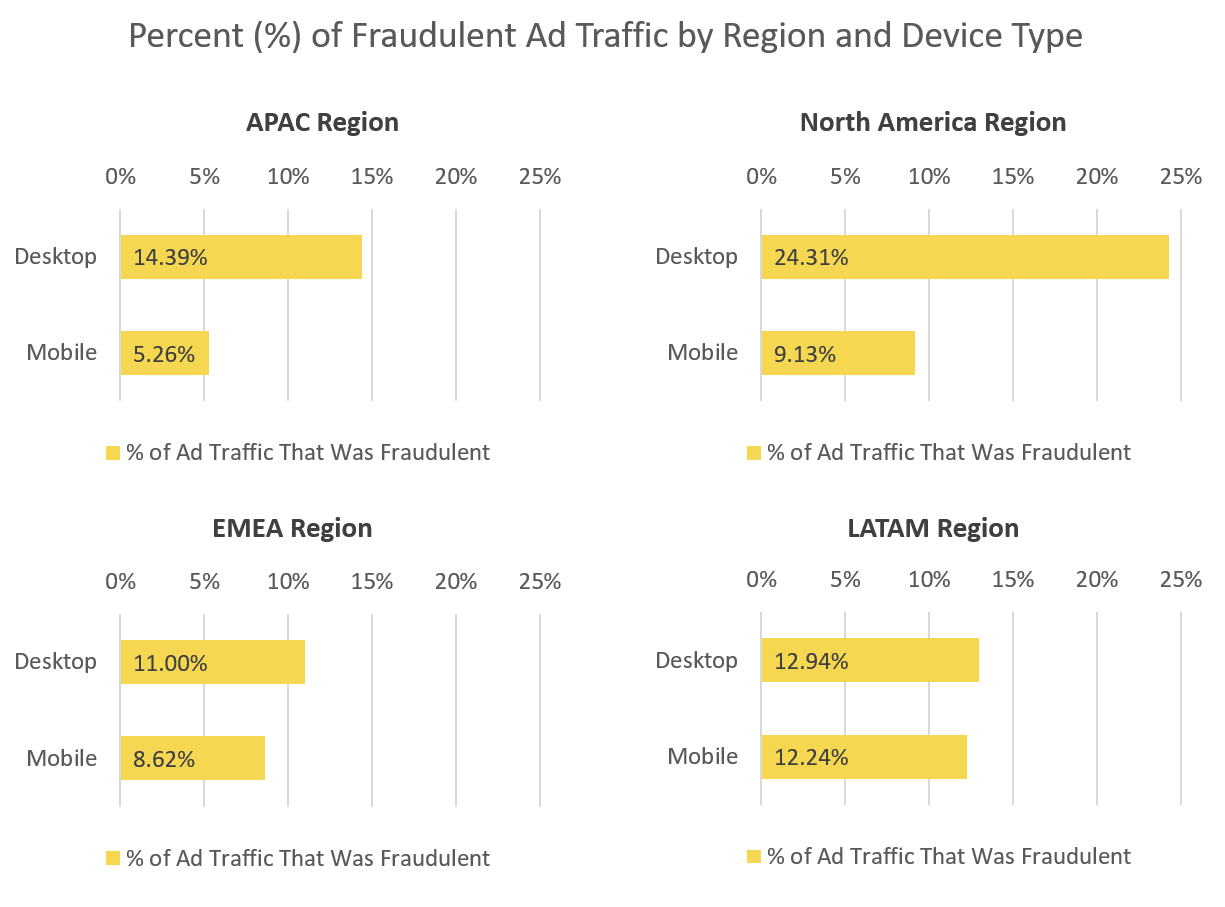
Breaking the ad traffic down to the percentage of fraudulent traffic by region and device type, we found that the North America region had the highest percentage of fraudulent desktop traffic at 24%. The LATAM region had the highest percentage of fraudulent mobile traffic at 12%. Globally, 18% of desktop ad traffic and 10% of mobile ad traffic was fraudulent. Here's how the the data from different regions looked:
As we've demonstrated here, ad fraud rates can look very different depending on geography and device type. In the coming weeks we'll be looking into the ad fraud rates as they break down according to browsers, operating systems, and more.
