
In September 2018 we began reporting ad fraud statistics for the programmatic ad space based on monthly data we collected. We then published our first Quarterly Ad Fraud Report with data from Q4, 2018. We're continuing this coverage with our Q1 2019 Ad Fraud Report, which includes data on which devices, browsers and operating systems are being used most for fraud and what areas of the world fraudulent traffic is originating from.
Download a copy of this report.
A PDF of our Q1 2019 Programmatic Ad Fraud Report is provided in the link below.

Below are some of the highlights from Q1 2019. Fraudlogix’s pixel-based technology regularly monitors data from 640+ million unique users, 1.2 billion unique devices, and 300+ million URLs and apps monthly. We map the latest devices, locations, bots, behaviors and hacking tactics that are being used by digital fraudsters.
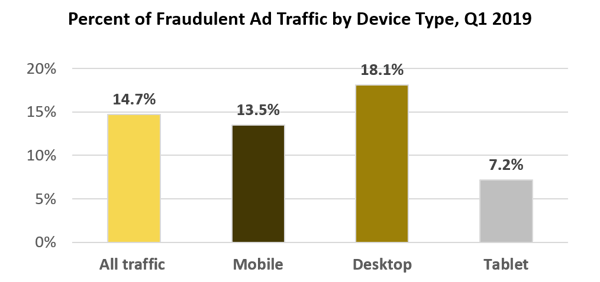
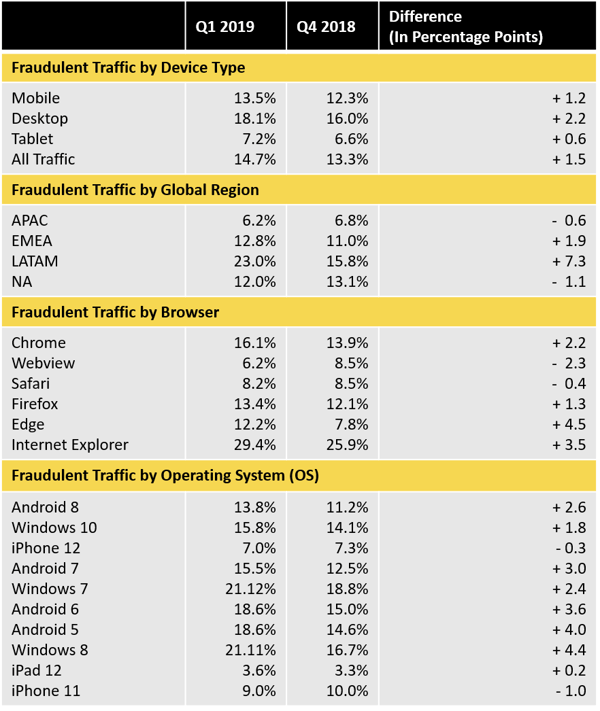
14.7% of all ad traffic was fraudulent.
Looking at digital ad traffic globally (all locations and all device types), we found that 14.7 percent of it was fraudulent, an 11 percent increase from Q4, 2018. The biggest increase in fraud came from desktop display traffic, which was 18.1 percent fraudulent, a 13.6 percent increase from Q4 2018.
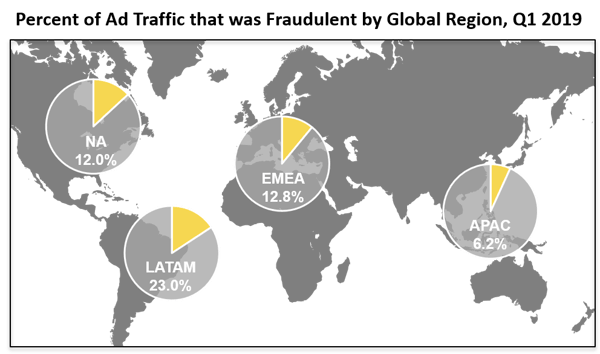
23% of LATAM ad traffic was fraudulent - the highest among four global regions.
Looking at all data during Q1 2019, broken down into four major global business regions [Asia–Pacific, including India (APAC); Europe, the Middle East and Africa, including Russia (EMEA); Latin America, including Mexico (LATAM); and North America (NA)], we found that ad traffic coming from the LATAM region had the highest percentage of fraud at 23.0%, followed by the EMEA region with 12.8%, North America at 12.0% and the APAC region with 6.2%.
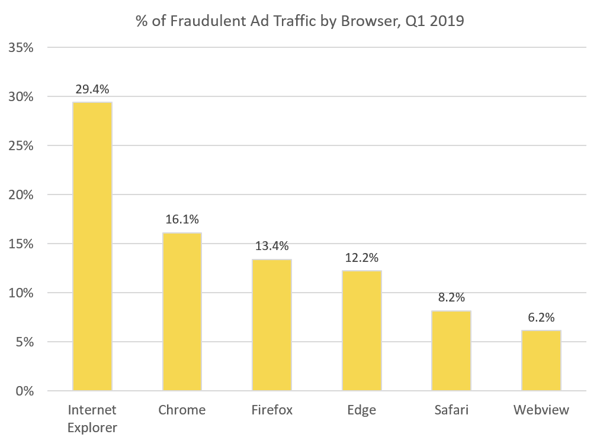
A majority of ad traffic came from Chrome browsers and 16% of it was fraudulent.
Like in Q4 2018, Google's Chrome browsers accounted for 68 percent of all ad traffic, however, the percentage of fraudulent traffic jumped from 14 percent to 16 percent. Internet Explorer again had the highest percentage of fraudulent traffic at 29 percent.
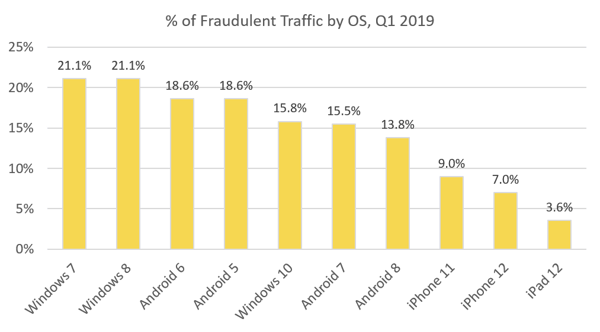
Devices running versions of Android 8 dominated - 13.8 percent of that ad traffic was fraudulent.
In Q1 the most common operating system among devices was the Android 8 (20 percent), followed by devices running Windows 10 (16.3 percent). Ad traffic coming from Android 8 operating systems was 13.8 percent fraudulent. Ad traffic coming from Windows 7 operating systems was the riskiest - 21.1 percent of it was fraudulent.
Quarter Over Quarter Change: Q1 2019 and Q4 2018
As we continue to track trends and data over time, we'll update the following chart:
Keep an eye out for further insights.
Keeping the industry updated on the latest data and threats we see in the digital ad community is important, so we we'll be publishing regular updates on ad fraud percentages as well as which countries, devices, browsers and operating systems are being taken advantage the most for ad fraud schemes. Stay tuned.
