
Microsoft's Internet Explorer continues with the dubious distinction of having the riskiest traffic for advertisers in Q2 2019 with 26% of it fraudulent. Meanwhile, Google's Chrome continues to dominate the market with 65% of all ad traffic originating from the browser, and 14% of that traffic was fake.
Download a copy of this report.
A PDF of our Q2 2019 Programmatic Ad Fraud Report is provided in the link below.

This post concentrates on the current percentage of fraud coming from the most common Internet browsers. Keep in mind that Fraudlogix’s pixel-based technology regularly monitors data from 710+ million unique users, 1.2 billion unique devices, and 300+ million URLs and apps monthly. We map the latest devices, locations, bots, behaviors and hacking tactics that are being used by digital fraudsters within mobile, in-app, display, video, and OTT environments. Key insights and data below.
Majority of ad traffic continues to come from Chrome browsers
Like in previous reports, Google's Chrome browsers accounted for a majority of all ad traffic (65%). Apple's Safari browser accounted for 8% of traffic, Firefox 3%, Microsoft Edge 3%, and Internet Explorer 3%. 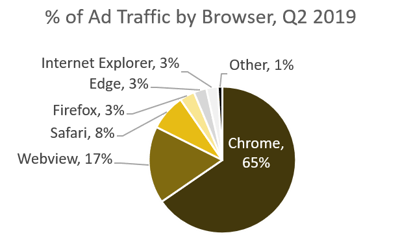
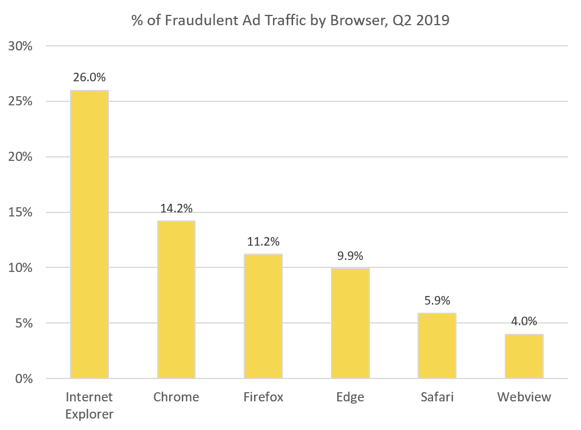
Ad traffic from Chrome browsers was 14.2% fraudulent, Internet Explorer continues to have riskiest traffic
The percentage of fraudulent traffic from Chrome browsers was 14.2%. Internet Explorer, although one of the least-used browsers, again had the highest percentage of fraudulent traffic at 26%. Firefox had 11.2% fraudulent ad traffic, Microsoft Edge had 9.9% fraudulent ad traffic, Safari had 5.9% fraudulent ad traffic, and in-app Webview had 4% fraudulent ad traffic.
Keep an eye out for further insights.
In September 2018 we began reporting ad fraud statistics for the programmatic ad space based on monthly data we collected. We then published our first Quarterly Ad Fraud Report with data from Q4, 2018. We're continuing this coverage with our Q2 2019 Ad Fraud Report, which includes data on which devices, browsers and operating systems are being used most for fraud and what areas of the world fraudulent traffic is originating from.
Keeping the industry updated on the latest data and threats we see in the digital ad community is important, so we we'll be publishing regular updates on ad fraud percentages as well as which countries, devices, browsers and operating systems are being taken advantage the most for ad fraud schemes. Stay tuned.
