
The Latin American region had the highest percentage of fraudulent traffic globally in Q2 2019 with 13.5% of its ad traffic determined to be invalid. Globally, the fraud percent was 12%.
Download a copy of this report.
A PDF of our Q2 2019 Programmatic Ad Fraud Report is provided in the link below.

This post concentrates on the current percentage of fraud, broken down into four major global business regions [Asia–Pacific, including India (APAC); Europe, the Middle East and Africa, including Russia (EMEA); Latin America, including Mexico (LATAM); and North America (NA)]. Keep in mind that Fraudlogix’s pixel-based technology regularly monitors data from 710+ million unique users, 1.2 billion unique devices, and 300+ million URLs and apps monthly. We map the latest devices, locations, bots, behaviors and hacking tactics that are being used by digital fraudsters within mobile, in-app, display, video, and OTT environments. Key insights and data are included below:
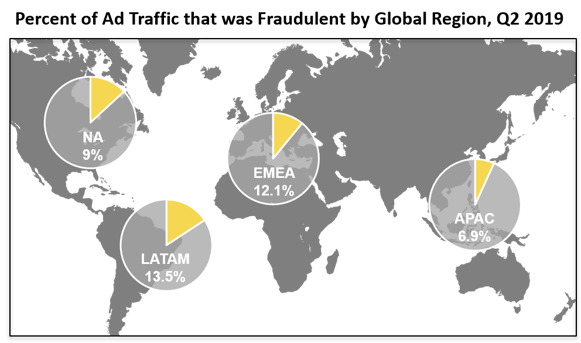
13.5% of LATAM ad traffic was fraudulent - the highest among four global regions.
Looking at all data during Q2 2019, we found that ad traffic coming from the LATAM region had the highest percentage of fraud at 13.5%, followed by the EMEA region with 12.1%, North America at 9.0% and the APAC region with 6.9%. Globally, the percentage of fraudulent traffic was 11.9% for Q2 2019.
In the United States, 9.7% of ad traffic was fraudulent
In the United States, 9.7% of ad traffic was fraudulent during the second quarter of 2019, lower than the global percentage of 11.9%. A majority of traffic (66.8%) was mobile, which is higher than the 62% seen globally.
Keep an eye out for further insights.
In September 2018 we began reporting ad fraud statistics for the programmatic ad space based on monthly data we collected. We then published our first Quarterly Ad Fraud Report with data from Q4, 2018. We're continuing this coverage with our Q2 2019 Ad Fraud Report, which includes data on which devices, browsers and operating systems are being used most for fraud and what areas of the world fraudulent traffic is originating from.
Keeping the industry updated on the latest data and threats we see in the digital ad community is important, so we we'll be publishing regular updates on ad fraud percentages as well as which countries, devices, browsers and operating systems are being taken advantage the most for ad fraud schemes. Stay tuned.
