
Globally, across all devices and regions, the percent of fraudulent ad traffic hovered around 12% in Q2 2019. A majority (62%) of it came from mobile devices with 11.6% of that traffic fraudulent.
Download a copy of this report.
A PDF of our Q2 2019 Programmatic Ad Fraud Report is provided in the link below.

This post concentrates on the current percentage of fraud in the programmatic landscape and within each of the major device channels (mobile, desktop, and tablet). Keep in mind that Fraudlogix’s pixel-based technology regularly monitors data from 710+ million unique users, 1.2 billion unique devices, and 300+ million URLs and apps monthly. We map the latest devices, locations, bots, behaviors and hacking tactics that are being used by digital fraudsters within mobile, in-app, display, video, and OTT environments. Key insights and data included below.
11.9% of all ad traffic was fraudulent.
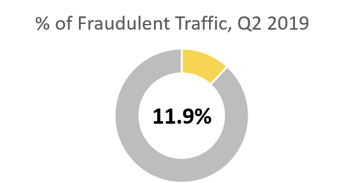 Looking at digital ad traffic globally (all locations and all device types), we found that 11.9% of it was fraudulent, a decrease from the previous quarter, but close to what we first reported in the Fall of 2018. In the fourth quarter of 2018 we saw an increase in fraud, which correlated with the increase in online advertising during the holiday season. Fraud levels decreased from from their highest levels in January throughout the the first quarter of 2019.
Mobile ad traffic dominates, 11.6% of it fraudulent 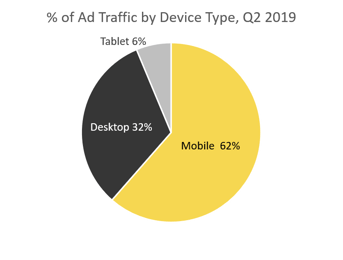
A majority of ad traffic observed, 61%, continued to come from mobile devices. This is inline with the increase in mobile advertising spending seen throughout the industry. Desktop ad traffic accounted for 32% and tablet 6%.
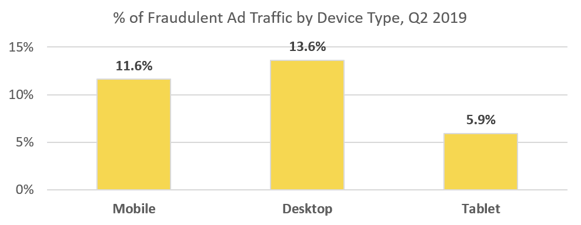
Looking at the percentage of fraudulent traffic within these channels, mobile ad traffic was 11.6% fraudulent, desktop 13.6% fraudulent, and tablet 5.9% fraudulent.
Keep an eye out for further insights.
In September 2018 we began reporting ad fraud statistics for the programmatic ad space based on monthly data we collected. We then published our first Quarterly Ad Fraud Report with data from Q4, 2018. We're continuing this coverage with our Q2 2019 Ad Fraud Report, which includes data on which devices, browsers and operating systems are being used most for fraud and what areas of the world fraudulent traffic is originating from.
Keeping the industry updated on the latest data and threats we see in the digital ad community is important, so we we'll be publishing regular updates on ad fraud percentages as well as which countries, devices, browsers and operating systems are being taken advantage the most for ad fraud schemes. Stay tuned.
